K-Means Tuning
Tuning is a crucial aspect of K-Means implementations since hyperparameters such as n_clusters and max_iter can be very significant in the clustering outcomes. Furthermore, in most cases deciding the cluster amounts is an iterative process and will require analyst or scientist to adjust n_clusters multiple times.
We created this tutorial to provide a practical insight to the most commonly practiced K-Means tuning and optimizations.
How many clusters do you want?
1- n_clusters parameter
Cluster size is probably the main parameter that should be adjusted when working with K-Means models. It will delineate the amount of clusters the model with come up with.
Finding the right n_clusters can be difficult since when you are trying to figure out the data yourself but clustering can be an iterative process and you can evaluate the results and re-tune the n_clusters parameter.
Assessment can be made by analyzing the cluster outputs visually as well as in data format. If similar clusters could be consolidated you can lower the n_clusters parameter accordingly. If you find certain cluster(s) to be too large you can increase the n_clusters parameter.
KM = KMeans(n_clusters = 5)
K-Means Parameters
- n_clusters
- n_init
- max_iter
- init
- algorithm
init algorithms
- k-means++
- “random”
- custom array
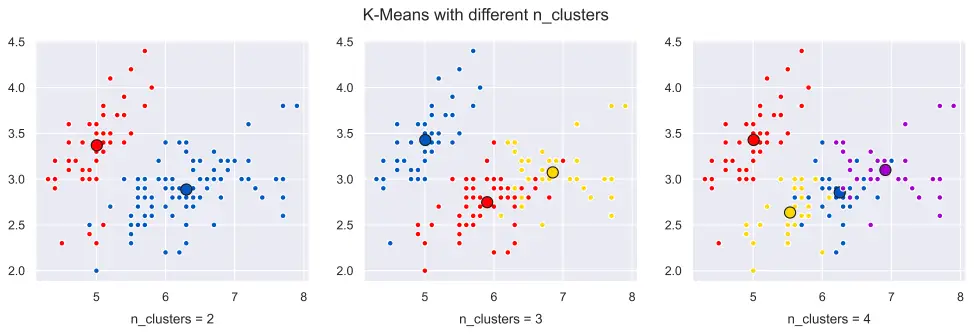
a) Visualization for n_clusters
Below you can see a visualization of different n_clusters values for K-Means.
Please see the article below for details regarding how to create a similar K-Means cluster visualization with multiple subplots using Matplotlib, Scikit-Learn and Python:
b) inertia based n_clusters
Another important concept for K-Means is the inertia value. Inertia is calculated as sum of Euclidean distances of samples for cluster centroids. Inertia tends to decrease as cluster amount increases since samples will be getting closer to their respective cluster centers.
However, we can also observe bigger drops in inertia (drops with higher slope value) as clusters start to form unnecessarily. This is due to the fact that, if we create sub-cluster on the same cluster inertia value will be significantly lower compared to separate clusters.
This phenomenon can be very useful to determine ideal cluster amounts for a dataset or at least to define an n_clusters value to start with. After creating a K-Means model and fitting it, you can print the inertia using .inertia_ attribute of KMeans.
Here is a Python code example:
KM = KMeans(n_clusters = 5)
KM.fit(X)

print(KM.inertia_)
681.3705999999996
We can visualize different n_clusters values on the same dataset using the same model to see after which n_clusters value rate of decrease in inertia stalls.
import pandas as pd
import matplotlib.pyplot as plt
from sklearn.datasets import load_iris
iris = load_iris()
data = pd.DataFrame(iris['data'])
inertia_list = []

K_list = range(1,10)
for i in K_list:
    KM = KMeans(n_clusters=i)
    KM.fit(data)
    inertia_list.append(KM.inertia_)
    print(KM.inertia_)
plt.figure(figsize=(10,4))
plt.plot(range(1,10), inertia_list, 'o-', markersize=7, markerfacecolor='black')
plt.xlabel('n_clusters'); plt.ylabel('Inertia'); plt.title('K-Means Elbow Technique')
plt.hlines(y = (inertia_list[2]), xmin=K_list[0], xmax=K_list[-1], color = 'r', linestyles = 'dashed')
plt.show()
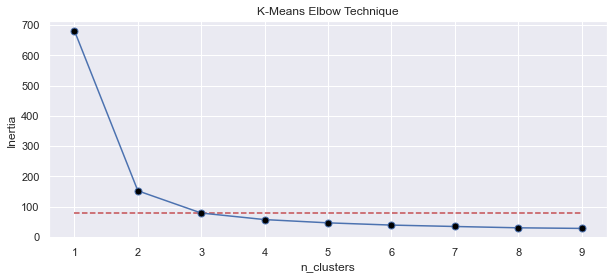
You can see how drop in inertia stalls at n_clusters=3 hinting us that 3 is the amount of clusters in data with major differences or separation in between based on the data provided.
That’s really the case here since Iris dataset consists of 3 classes. It doesn’t mean that there is no value in choosing n_clusters values outside the value found by elbow method and it’s up to your interpretation but elbow technique does provide a valuable indicator.
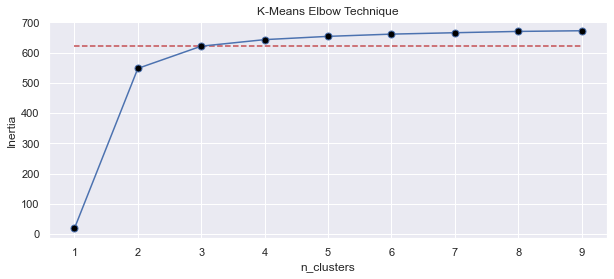
inertia_list.append(700-KM.inertia_)
Alternatively, you can flip the graph vertically by flipping the mathematical sign of inertia values. Here is an example of elbow method chart created with such a list.
Centroid Initialization
2- n_init
n_init is another important parameter in K-Means algorithm. This value defines the amount of initiations that will be made for centroids initially.
K-Means algorithm will run with different centroid values and best set will be implemented in the algorithm based on inertia values.
Default value 10 usually works well however you can increase to increase the amount of attempts in search of a better centroid initialization.
KM = KMeans(n_init = 20)
Maximum K-Means Iterations
3- max_iter
After initialization of centroids K-Means model will start making iterations with them each time trying to find more optimal values for clustering.
max_iter is the maximum amount of iterations that will be made. It is 300 by default in Scikit-Learn KMeans implementation.
KM = KMeans(max_iter=200)
max_iter will also affect the runtime performance and complexity of K-Means algorithm directly. You can see this page for more detail about K-Means complexity and iteration amount’s effects on complexity:
Maximum K-Means Iterations
4- init
init parameter is used to specify the initialization algorithm for cluster centroids. k-means++ is a very popular algorithm that’s used as default for centroid initialization.
a) init parameter values
k-means++ selects a random point as its starting point and then establishes the rest of the cluster centers as distant as possible from each other ensuring the whole data is covered.
So, if x point is initiated randomly on the data according to k-means++ algorithm, n_clusters-1 data points will be distributed to the rest of the data in a way that they have maximum possible distance between them.
- k-means++ is a very efficient approach to centroid initialization and it’s also the default value for init parameter in Scikit-Learn’s KMeans class.
- If init is assigned to “random” centroids will be initialized completely randomly based on the random_state seed.
- You can also assign a custom array to init parameter. This can sometimes be useful if you already know where approximately cluster centers should be or where you want to force the cluster centers to be.
KM = KMeans(init="k-means++")
b) Research on K-Means Centroid Initialization
You can also see this recent research paper by PasiFränti and SamiSieranoja which elaborates quite a lot on the initation methods and their effects on K-Means performance. Here is a quote from findings of their research:
if the clusters overlap, the choice of initialization technique does not matter much, and repeated k-means is usually good enough for the application. However, if the data has well-separated clusters, the result of k-means depends merely on the initialization algorithm.
-September 2019, How much can k-means be improved by using better initialization and repeats?
This makes sense and underlines the benefits of k-means++ initialization algorithm especially when clusters are expected to be wel- separated.
Summary
In this Machine Learning Tutorial we have seen some of the intricacies of tuning K-Means models. We have seen K-Means hyperparameters such as init, n_init and max_iter and we’ve discussed their use.
We’ ve also introduced elbow technique which is a useful method to define ideal cluster size in K-Means implementations. We have also seen a couple of K-Means visualization techniques including visualization of elbow method.
For other concepts such as K-Means Performance, Advantages and Disadvantages, you can see the main K-Means Tutorial page below: